Archive

November 7, 2025

Browsing

Markets don’t usually hit record highs, risk falling into bearish territory, and spring back to new highs within six months. But that’s what happened in 2025.

In this special mid-year recap, Grayson Roze sits down with David Keller, CMT, to show how disciplined routines, price-based signals, and a calm process helped them ride the whipsaw instead of getting tossed by it. You’ll see what really happened under the surface, how investor psychology drove the swings, and the exact StockCharts tools they leaned on to stay objective. 

If you’re focused on protecting capital, generating income, and sleeping well at night while still capturing the upside, this is a must-watch. Discover which charts deserve your attention now, what to ignore, and how to prep for the back half of 2025. 

This video premiered on July 23, 2025. Click on the above image to watch on our dedicated Grayson Roze page on StockCharts TV.

You can view previously recorded videos from Grayson at this link.

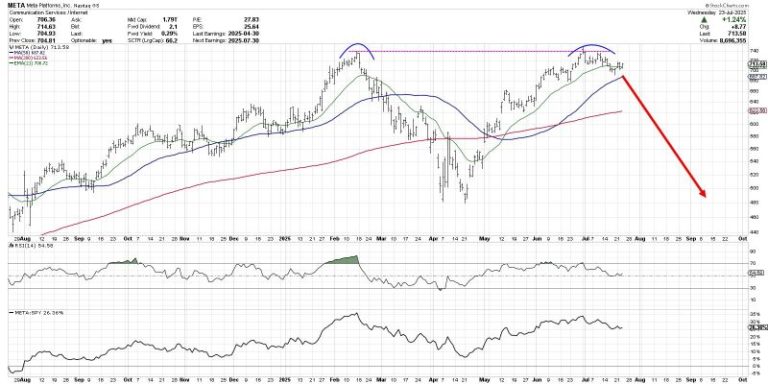
The chart of Meta Platforms, Inc. (META) has completed a roundtrip from the February high around $740 to the April low at $480 and all the way back again.  Over the last couple weeks, META has now pulled back from its retest of all-time highs, leaving investors to wonder what may come next.

Is this the beginning of a new downtrend phase for META?  Or just a brief pullback before a new uptrend phase propels META to new all-time highs?

Today we’ll look at two potential scenarios, including the double top pattern and the cup and handle pattern, and share which technical indicators and approaches could help us determine which path plays out into August.

The double top scenario basically means that the late July retest of the previous all-time high was the end of the recent uptrend phase.  The double top pattern is literally when a major resistance level is set and then retested.  The implication is that a lack of willing buyers means the uptrend is exhausted, and there is nowhere to go but down.

While the 21-day exponential moving average is currently in play for META, I would say that a break below the 50-day moving average could confirm this as the correct scenario.  If that smoothing mechanism does not hold, then the price action would imply less of a pullback and more like the beginning of a real distribution phase.

What is META pulls back but then resumes an uptrend phase, leading META to another new all-time high?  That would result in a confirmed cup and handle pattern, created by a large rounded bottoming pattern followed by a brief pullback.  The key to this pattern is the “rim” of the cup, which sits right at $740 for META.

Given the pullback META has demonstrated so far in July, I would say that a break above the $740 level would basically confirm a bullish cup and handle pattern.  That would suggest much more upside potential for META, as the stock would literally go into previously uncharted territory.

So how can we determine which scenario is more likely to play out?  This is where we need to incorporate more technical indicators into the discussion, as a way to further validate and confirm our investment thesis.

Just to review, I think a break above $740 would confirm a bullish cup and handle pattern.  I would also say that a break below the $680 level, which would represent a move below the 50-day moving average as well as the June swing lows, would basically confirm a bearish double top pattern.

We can also use the Relative Strength Index (RSI) to help determine whether META remains in a bullish trend phase.  During bull phases, the RSI rarely gets below 40, because buyers usually step in to “buy the dips” and keep the momentum fairly constructive.  So if the price would break down, and the RSI would not hold that crucial 40 level, that could mean a bearish outlook is warranted.

Finally, we can use volume-based indicators to assess whether moves in the price are supported by stronger volume readings.  Here I’ve included the Accumulation/Distribution Line, which tracks the trend in daily volume readings over time.  We can see that the high in July resulted in a divergence, as the A/D line was trending lower.  If the A/D line would break below its June and July lows, marked by a dashed red line, that would represent a bearish volume reading for META.

Technical analysis is less about predicting the future, and more about determining the most probable scenarios based on our analysis of trend, momentum, and volume.  I hope this discussion shows how the outlook for META can be easily determined and tracked using the best practices of technical analysis!

RR#6,

Dave

PS- Ready to upgrade your investment process?  Check out my free behavioral investing course!

David Keller, CMT

President and Chief Strategist

Sierra Alpha Research LLC

marketmisbehavior.com

https://www.youtube.com/c/MarketMisbehavior

Disclaimer: This blog is for educational purposes only and should not be construed as financial advice.  The ideas and strategies should never be used without first assessing your own personal and financial situation, or without consulting a financial professional.  

The author does not have a position in mentioned securities at the time of publication.    Any opinions expressed herein are solely those of the author and do not in any way represent the views or opinions of any other person or entity.

Is the market’s next surge already underway? Find out with Tom Bowley’s breakdown of where the money is flowing now and how you can get in front of it.

In this video, Tom covers key moves in the major indexes, revealing strength in transports, small caps, and home construction. He identifies industry rotation signals, which are pointing to aluminum, recreational products, and furnishings. Tom then demonstrates how to use StockCharts’ tools to scan for momentum stocks in emerging leadership groups — see why SGI tops Tom’s list. He ends with a discussion of post-earnings reactions from major names like GOOGL, TSLA, IBM, and LVS. 

And, of course, Tom wraps every idea with clear chart setups you can act on today. 

This video premiered on July 24, 2025. Click this link to watch on Tom’s dedicated page.

Missed a session? Archived videos from Tom are available at this link.

The S&P 500 ($SPX) just logged its fifth straight trading box breakout, which means that, of the five trading ranges the index has experienced since the April lows, all have been resolved to the upside.

How much longer can this last? That’s been the biggest question since the massive April 9 rally. Instead of assuming the market is due to roll over, it’s been more productive to track price action and watch for potential changes along the way. So far, drawdowns have been minimal, and breakouts keep occurring. Nothing in the price action hints at a lasting change — yet.

While some are calling this rally “historic,” we have a recent precedent. Recall that from late 2023 through early 2024, the index had a strong start and gave way to a consistent, steady trend.

From late October 2023 through March 2024, the S&P 500 logged seven consecutive trading box breakouts. That streak finally paused with a pullback from late March to early April, which, as we now know, was only a temporary hiccup. Once the bid returned, the S&P 500 went right back to carving new boxes and climbing higher.

New 52-Week Highs Finally Picking Up

If there’s been one gripe about this rally, it’s that the number of new highs within the index has lagged. As we’ve discussed before, among all the internal breadth indicators available, new highs almost always lag — that’s normal. What we really want to see is whether the number of new highs begins to exceed prior peaks as the market continues to rise, which it has, as shown by the blue line in the chart below.

As of Wednesday’s close, 100 S&P 500 stocks were either at new 52-week highs or within 3% of them. That’s a strong base. We expect this number to continue rising as the market climbs, especially if positive earnings reactions persist across sectors.

Even when we get that first day with 100+ S&P 500 stocks making new 52-week highs, though, it might not be the best time to initiate new longs.

The above chart shows that much needs to align for that many stocks to peak in unison, which has historically led to at least a short-term consolidation, if not deeper pullbacks — as highlighted in yellow. Every time is different, of course, but this is something to keep an eye on in the coming weeks.

Trend Check: GoNoGo Still “Go”

The GoNoGo Trend remains in bullish mode, with the recent countertrend signals having yet to trigger a greater pullback.

Active Bullish Patterns

We still have two live bullish upside targets of 6,555 and 6,745, which could be with us for a while going forward. For the S&P 500 to get there, it will need to form new, smaller versions of the trading boxes.

Failed Bearish Patterns

In the chart below, you can view a rising wedge pattern on the recent price action, the third since April. The prior two wedges broke down briefly and did not lead to a major downturn. The largest pullbacks in each case occurred after the S&P 500 dipped below the lower trendline of the pattern.

The deepest drawdown so far is 3.5%, which is not exactly a game-changer. Without downside follow-through, a classic bearish pattern simply can’t be formed, let alone be broken down from.

We’ll continue to monitor these formations as they develop because, at some point, that will change.

Here are some charts that reflect our areas of focus this week at


XLU Leads with New High

Even though the Utilities SPDR (XLU) cannot keep pace with the Technology SPDR (XLK) and Communication Services SPDR (XLC), it is in a leading uptrend. XLU formed a cup-with-handle from November to July and broke to new highs the last two weeks. ETFs hitting new highs are in strong uptrends and should be on our radar.


Metal Mania in 2025

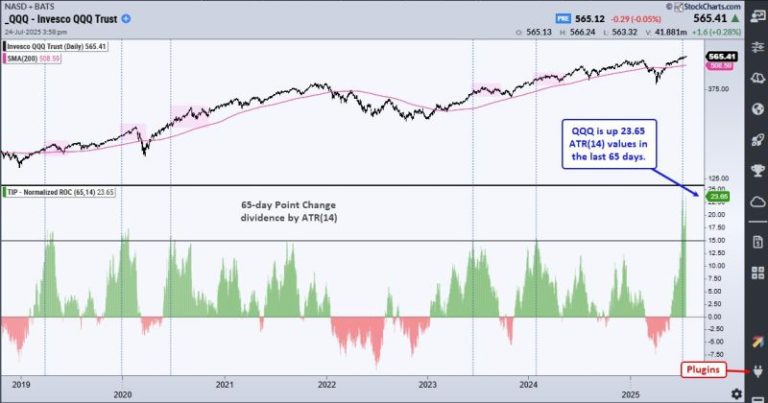
In a tribute to Ozzy, metals are leading the way higher in 2025. The PerfChart below shows year-to-date performance for the continuous futures for 12 commodities. Copper, Platinum and Palladium are up more than 45% year-to-date, while Gold is up 28.38% and Silver is up 35.30%. QQQ is up 10.52% year-to-date, but lagging these metals. The other commodities are mixed.


Multi-Year Highs for Silver and Copper

The next chart shows 11 year bar charts for five metals. Gold broke out in early 2024 and led the metals move with an advance the last 21 months. Silver and copper broke out to multi-year highs. Platinum broke above its 2021 high and Palladium got in the action with an 18 month high. There is a clear message here: metals are moving higher and leading as a group.  


Home Construction Hits Moment of Truth

The Home Construction ETF (ITB) hit its moment of truth as it rose to its falling 40-week SMA. Notice that ITB failed just below this moving average in August 2023. During the 2023-2024 uptrend, the 40-week SMA was more friendly as ITB reversed near this level in October 2023 and June 2024. ITB surged to the falling 40-week SMA in July, but the long-term trend is down and this area could be its nemesis.

Thanks for Tuning in!

See TrendInvestorPro.com for more


Nevada Sunrise Metals Corporation (TSXV: NEV,OTC:NVSGF) (OTC Pink: NVSGF) (‘Nevada Sunrise’ or the ‘Company’) is pleased to announce it has closed a non-brokered private placement (the ‘Offering’) for gross proceeds of $650,000, consisting of 13,000,000 units (the ‘Units’) at a price of $0.05 per Unit, with each Unit comprised of one common share of the Company and one common share purchase warrant (a ‘Warrant’). Each Warrant will entitle the holder to purchase one common share at a price of $0.075 for a period expiring three years from the closing date of the Offering. Due to investor demand, the Offering was increased from $600,000 (12,000,000 Units) (see news release dated October 16, 2025) to $650,000 (13,000,000 Units).

Proceeds of the Offering will be used for:

  • Exploration work on the Company’s Nevada mineral properties;
  • Other mineral property investigations, and general working capital.

The Offering was available to accredited investors and individuals that qualified under certain other statutory exemptions. The securities issued pursuant to the Offering are subject to a statutory hold period expiring March 7, 2026. In connection with the closing of the Offering, the Company paid finder’s fees consisting of a total of $31,500 cash and 630,000 finder’s warrants (each a ‘Finder’s Warrant‘) to Canaccord Genuity Corp. Each Finder’s Warrant is exercisable at a price of $0.075 for a period of three years from the closing date of the Offering. The Offering is subject to acceptance of the TSX Venture Exchange.

This news release does not constitute an offer of sale of any of the foregoing securities in the United States. None of the foregoing securities have been and will not be registered under the U.S. Securities Act of 1933, as amended (the ‘1933 Act‘) or any applicable state securities laws and may not be offered or sold in the United States or to, or for the account or benefit of, U.S. persons (as defined in Regulation S under the 1933 Act) or persons in the United States absent registration or an applicable exemption from such registration requirements. This news release does not constitute an offer to sell or the solicitation of an offer to buy nor will there be any sale of the foregoing securities in any jurisdiction in which such offer, solicitation or sale would be unlawful.

About Nevada Sunrise

Nevada Sunrise is a junior mineral exploration company with a strong technical team based in Vancouver, BC, Canada, that holds interests in gold, copper and lithium exploration projects located in the State of Nevada, USA.

Nevada Sunrise holds the right to purchase a 100% interest in the Griffon Gold Mine Project, located approximately 50 kilometers (33 miles) southwest of Ely, NV.

Nevada Sunrise holds the right to earn a 100% interest in the Coronado Copper Project, located approximately 48 kilometers (30 miles) southeast of Winnemucca, NV.

Nevada Sunrise owns 100% interests in the Gemini West, Jackson Wash and Badlands lithium projects, all of which are located in the Lida Valley in Esmeralda County, NV.

As a complement to its exploration projects in Esmeralda County, the Company owns Nevada Water Right Permit 86863, also located in the Lida Valley basin, near Lida, NV.

For Further Information Contact:

Warren Stanyer, President and Chief Executive Officer
email: warrenstanyer@nevadasunrise.ca
Telephone: (604) 428-8028
Website: www.nevadasunrise.ca

FORWARD LOOKING STATEMENTS

This release may contain forward‐looking statements. Forward looking statements are statements that are not historical facts and are generally, but not always, identified by the words ‘expects’, ‘plans’, ‘anticipates’, ‘believes’, ‘intends’, ‘estimates’, ‘projects’, ‘potential’ and similar expressions, or that events or conditions ‘will’, ‘would’, ‘may’, ‘could’ or ‘should’ occur and include disclosure of anticipated exploration activities. Although the Company believes the expectations expressed in such forward‐looking statements are based on reasonable assumptions, such statements are not guarantees of future performance and actual results may differ materially from those in forward looking statements. Forward‐looking statements are based on the beliefs, estimates and opinions of the Company’s management on the date such statements were made. The Company expressly disclaims any intention or obligation to update or revise any forward‐looking statements whether as a result of new information, future events or otherwise.

Such factors include, among others, risks related to future plans for the Company’s Nevada mineral properties; reliance on technical information provided by third parties on any of our exploration properties; changes in mineral project parameters as plans continue to be refined; current economic conditions; future prices of commodities; possible variations in grade or metallurgical recovery rates; failure of equipment or processes to operate as anticipated; the failure of contracted parties to perform; labor disputes and other risks of the mining industry; delays due to pandemic; delays due to weather; delays in obtaining governmental approvals, financing or in the completion of exploration, as well as those factors discussed in the section entitled ‘Risk Factors’ in the Company’s Management Discussion and Analysis for the Nine Months ending June 30, 2025, which is available under Company’s SEDAR profile at www.sedarplus.com.

Although Nevada Sunrise has attempted to identify important factors that could cause actual actions, events or results to differ materially from those described in forward-looking information, there may be other factors that cause actions, events or results not to be as anticipated, estimated or intended. There can be no assurance that such information will prove to be accurate as actual results and future events could differ materially from those anticipated in such statements. Nevada Sunrise disclaims any intention or obligation to update or revise any forward-looking information, whether as a result of new information, future events or otherwise. Accordingly, readers should not place undue reliance on forward-looking information.

Neither TSX Venture Exchange nor its Regulation Services Provider (as that term is defined in the policies of TSX Venture Exchange) accepts responsibility for the adequacy or accuracy of this release.

NOT FOR DISSEMINATION IN THE UNITED STATES OR TO UNITED STATES NEWSWIRE SERVICES

To view the source version of this press release, please visit https://www.newsfilecorp.com/release/273569

News Provided by Newsfile via QuoteMedia

This post appeared first on investingnews.com

Here’s a quick recap of the crypto landscape for Wednesday (November 5) as of 9:00 p.m. UTC.

Get the latest insights on Bitcoin, Ether and altcoins, along with a round-up of key cryptocurrency market news.

Bitcoin and Ether price update

Bitcoin (BTC) was priced at US$103,902, a 3.3 percent increase in 24 hours and its highest valuation of the day. Bitcoin’s lowest valuation on Wednesday was US$102,377.

Bitcoin price performance, November 5, 2025.

Chart via TradingView.

Both Bitcoin and Ether (ETH) are showing signs of recovery after a volatile start to the week. Current price action is driven by derivatives liquidations, options settlement dynamics and sustained retail and institutional fear.

Ether ended the trading day at US$3,448.04, an increase of 7.5 percent over the last 24 hours. Its lowest valuation of the day was US$3,326.02. Like Bitcoin, Ether is attempting a rebound near a significant technical and psychological level, but uncertainty remains elevated. The Fear and Greed Index remains in “extreme fear” at 20, reflecting persistent nervousness after long-term holders and whales triggered mass liquidations.

“Market data and technical signals suggest Bitcoin may trade within a US$94,000–US$118,000 range in the near term. The lower bound represents a healthy retracement zone consistent with subdued ETF inflows, while the upper range reflects a measured recovery below the October high near US$125K. Ethereum is likely to move between US$3,000 and US$4,400, supported by Layer-2 expansion and renewed DeFi participation,’ she said via email.

“Overall, the market appears to be stabilizing in a more disciplined, data-driven manner, signaling that confidence is returning through structural resilience and steady capital reallocation.”

Meanwhile, Galaxy’s head of research, Alex Thorn, said that the investment company has lowered its 2025 Bitcoin price forecast from US$185,000 to US$120,000.

Altcoin price update

  • Solana (SOL) was priced at US$162.69, up by 6.6 percent over the last 24 hours and at its highest valuation of the day. Its lowest was US$157.65.
  • XRP was trading for US$2.37, up by 9.7 percent over the last 24 hours to its highest valuation of the day. Its lowest was US$2.25.

Crypto derivatives and market indicators

Over the past four hours, Bitcoin has seen liquidations totaling US$16.11 million, mostly in short positions, suggesting a short-covering rally and improving near-term sentiment. Futures open interest is fractionally down 0.15 percent to US$70.17 billion, indicating a minor position reduction after aggressive selling earlier in the week.

The funding rate is neutral at 0.001, signaling balanced sentiment between longs and shorts, while implied volatility remains elevated at 45.9 percent, pointing to continued market uncertainty.

Max pain for options expiry sits at US$104,000, a level that the Bitcoin price is approaching.

Meanwhile, US$27.84 million in Ether options positions, also primarily shorts, have been liquidated in the past four hours, contributing to the uptrend as risk reversals shift. Ether has seen a 1.51 percent increase in open interest to US$40.3 billion, and its funding rate is slightly negative at -0.001, strengthening the bullish undertone.

Bitcoin dominance stands at 57.21 percent.

Today’s crypto news to know

Ripple secures US$500 million boost at US$40 billion valuation

Ripple has raised US$500 million in a new funding round led by Fortress Investment Group and Citadel Securities, valuing the company at US$40 billion. The investment follows Ripple’s US$1 billion tender offer earlier this year at the same valuation, marking a continuation of investor confidence in the firm’s long-term outlook.

Ripple said the funds will strengthen its partnerships with financial institutions and expand its services across custody, stablecoin issuance and crypto treasury management. The company’s RLUSD stablecoin has gained traction for corporate payments amid clearer US regulations under the GENIUS Act. The funding also positions Ripple to deepen its role in global payments as more firms integrate stablecoins into settlement networks.

Canada announces plans to introduce stablecoin legislation

The Canadian government announced as part of its 2025 budget that it plans to introduce legislation regulating fiat-backed stablecoins. The legislation aims to provide a secure, stable framework encouraging the development of Canadian-dollar pegged stablecoins, modernizing payment systems and fostering digital innovation.

The new rules will require stablecoin issuers to maintain sufficient asset reserves to back their digital currencies, safeguard consumer interests and comply with national security standards to protect personal data.

The Bank of Canada will receive C$10 million over two years starting in the 2026 to 2027 period to oversee the new framework, with ongoing costs expected to be covered by stablecoin issuers.

Northern Data exits Bitcoin mining in US$200 million AI transition

Northern Data Group, Europe’s largest Bitcoin-mining company, is divesting its mining arm, Peak Mining, in a deal worth up to US$200 million as it pivots entirely toward artificial intelligence (AI) infrastructure. The transaction includes US$50 million in upfront cash and up to US$150 million in performance-based payments tied to future profits.

The move follows the Bitcoin halving this past April, which cut mining revenues in half and accelerated the firm’s strategic shift. The company plans to repurpose its mining facilities in Texas for high-performance AI workloads, which can yield up to 10 times more revenue per megawatt than Bitcoin mining.

The company already owns over 220,000 GPUs through prior acquisitions.

Balancer protocol suffers major exploit

The Balancer DeFi protocol suffered a major exploit on Tuesday (November 3), losing about US$128 million in assets from its V2 Composable Stable Pools due to a precision rounding error and access control flaws in its smart contracts.

According to a report released after the attack, the infiltrator manipulated swap calculations and batch swaps to drain liquidity across multiple blockchains, including Ether, Polygon, Arbitrum and others.

Balancer promptly paused affected pools, confirmed no impact on V3 or other versions, and is collaborating with forensic and security experts to trace and recover funds. So far, US$19.3 million worth of StakeWise osETH has been recovered. Balancer has offered a white hat bounty for full asset return within 48 hours and continues investigating.

Securities Disclosure: I, Giann Liguid, hold no direct investment interest in any company mentioned in this article.

Securities Disclosure: I, Meagen Seatter, hold no direct investment interest in any company mentioned in this article.

This post appeared first on investingnews.com

Fertilizer prices remained elevated in Q3 compared to both the first half of the year and the end of 2024.

Potash prices surged at the start of the year as the Trump administration threatened tariffs on Canada, the top supplier to US farmers. During the third quarter, prices were 20 percent higher than at the end of last year.

Meanwhile, phosphate prices continued to climb through Q3 on the back of supply shortages, spurred by export restrictions from top producer China. Prices were further influenced by US tariffs.

What happened to phosphate and potash prices in Q3?

According to data from the World Bank, the average quarterly phosphate price rose to US$770.60 per metric ton (MT), up from US$673.20 in Q2, and significantly higher than the annual average of US$563.70 in 2024.

On a monthly basis, phosphate climbed to US$736 in July, then climbed to a three year high of US$795.10 in August. Since then, the price has fallen to US$780.63 in September and US$754 in October.

The quarterly average for potash fell slightly in Q3 to US$352.20 per MT, down from US$359.20 the previous quarter, but remained higher than US$283.90 in the last quarter of 2024.

On a monthly basis, potash prices eased to US$362.50 in July, and continued to fall to US$356.50 in August. They sank further to US$352.50 in September and US$352 in October.

What factors impacted phosphate in Q3?

Phosphate prices have been primarily influenced over the last several years by export restrictions from China, which have declined to 6.6 million MT in 2024 from 9 million MT in 2021. The restrictions were put in place to protect the domestic supply, and while the hope was that they would eventually ease, that hasn’t happened.

“As expected, their exports started to arrive in July to September; however, the government had a self-imposed October 15 cutoff date for export submission. That date came and went without an extension, so now the belief is their flows will slow to a crawl very soon,” he said. The situation may face additional headwinds, as China has imposed more restrictions on key battery technologies and precursors for phosphate-based batteries. These restrictions will add to demand for ex-China supply as the agricultural sector competes with battery makers for a limited supply of phosphate.

Demand for phosphate is also high, particularly from India, which has been working to increase its stockpiles since the end of 2024, when they reached a low of 1.1 million MT. However, stockpiles had more than doubled to 2.4 million MT at the start of October, with imports climbing to 4 million MT during the April to September period.

Much of the demand has been covered by supply from Saudi Arabia and Morocco, which signed several offtake agreements with Indian importers in July. “They were a major driver of higher prices for much of 2025 as they played catch up on stockpiles, and have finally reached a comfortable number of tons, which has allowed them to slow their desperate pace. The slower demand pace has allowed the market time to breathe/correct lower,” Linville said.

For US-based farmers, supply isn’t the only issue.

On August 7, a host of new tariffs as high as 25 percent were applied to phosphate imports, including from Saudi Arabia, which accounted for 54.7 percent of imports during the first five months of the year. Although there were some concerns that higher prices could prompt farmers to rethink their strategy, Linville hasn’t seen that materialize either.

With reports that farm yields this year have been higher, it may prompt farmers who have been on the fence about a fall application of phosphate to reconsider, as a significant yield would indicate some phosphate soil depletion.

“While still spoty, we are continuing to hear reports that phosphate demand is better than expected,” he said.

However, Linville noted that a surge in last-minute demand it could make supplies tighter and limit the ability for phosphate to make it onto the fields.

What factors impacted potash in Q3?

Linville said potash news was quiet during the quarter, pointing to stable prices and a well-supplied market.

In July, BHP (ASX:BHP,NYSE:BHP,LSE:BHP) announced it was delaying the opening of its Jansen mine in Saskatchewan. It was initially slated to start production in 2026, but has instead moved its timeline back to 2027 and is also considering pushing the second phase to 2031, citing cost overruns that have ballooned to US$7 billion.

Although potash has so far escaped US tariffs, Linville noted some concern following Ontario’s anti-tariff ad, which ran in the US during the World Series. “We continue to hope/believe that potash will be left alone as part of the North America Trade agreement. Assuming potash is left alone, markets should continue as normal; however, if we start seeing barriers to entry, US farmers will likely bear the brunt of most/all of those tariffs,” he said

Potash and phosphate price forecast for 2025

While potash markets remain stable, phosphate markets are much more dynamic.

Unless there is a significant shift in China’s exports, supply should remain tight. In his most recent weekly update on November 5, Linville noted that the situation could become dire for US consumers before the end of the year.

“We continue to advise our people that if they decide they need phosphate after all, do not wait to lock it up. Days very well may matter. Heck, hours might matter. Supplies are tight and can ill-afford a sudden demand jump,” he wrote.

Additionally, markets are likely to become further strained in the years to come as limited supply meets increased demand from outside the agricultural sector.

Securities Disclosure: I, Dean Belder, hold no direct investment interest in any company mentioned in this article.

This post appeared first on investingnews.com