Archive

October 2025

Browsing

Global equities climbed this week as investors weighed looming risks from the US government shutdown, which delayed the release of essential jobs data on Friday (October 3).

Macro headlines emphasized the possible economic impact. However, despite uncertainty, both the S&P/TSX Composite Index (INDEXTSI:OSPTX) and Wall Street advanced this week, with the S&P 500 (INDEXSP:.INX) and Nasdaq Composite (INDEXNASDAQ:.IXIC) touching multiple record intraday highs.

The strength of the technology sector was a key driver behind these gains.

Chipmakers, tech infrastructure companies and artificial intelligence (AI) stocks led the rally, with gains to NVIDIA (NASDAQ:NVDA) and other semiconductor stocks underpinning broader market optimism.

The Nasdaq rose about 1.36 percent over the week’s five sessions.

Nasdaq Composite performance, September 29 to October 3, 2025.

Chart via Google Finance.

3 tech stocks that moved markets this week

1. CoreWeave (NASDAQ:CRWV)

CoreWeave landed up to US$14.2 billion in new business from Meta Platforms (NASDAQ:META) on the heels of a US$6.5 billion deal with OpenAI. Investors view this as affirmation of CoreWeave’s rising importance in the rapidly growing AI hardware market. CoreWeave climbed 11.6 percent, from US$120.71 to US$134.79, this week.

2. Shopify (NYSE:SHOP)

This Canadian e-commerce company’s shares soared after it received a price target upgrade this week.

TD Securities reinstated its ‘hold’ rating for Shopify and raised its price target from US$130 to US$156, citing strong revenue growth prospects and a strategic partnership with OpenAI to enable merchants to sell products directly through ChatGPT. Shopify’s share price climbed 13.68 percent this week, rising from US$141.75 to US$161.14.

3. Intel (NASDAQ:INTC)

Reports of a major chip-manufacturing agreement between Intel and Advanced Micro Devices (NASDAQ:AMD) surfaced on Friday. The deal reportedly involves Intel producing AMD-designed chips at its foundries.

The report was well received by investors, contributing to Intel’s strong share price performance and reflecting positive momentum for Intel’s manufacturing capabilities and growth strategy. AMD’s official response was a brief acknowledgment of the ongoing speculation, with no explicit denial. Shares of Intel saw a 6.69 percent increase this week, climbing from US$34.52 to US$36.83. AMD advanced by 2.84 percent.

Shopify, CoreWeave and Intel performance, September 29 to October 3, 2025.

Chart via Google Finance.

ETF performance

This week, the VanEck Semiconductor ETF (NASDAQ:SMH) gained 3.68 percent, while the Invesco PHLX Semiconductor ETF (NASDAQ:SOXQ) increased by approximately 3.39 percent.

For its part, the iShares Semiconductor ETF (NASDAQ:SOXX) advanced about 3.06 percent.

These gains reflect ongoing investor optimism for AI innovation and infrastructure buildup.

Other tech market news

            Tech news to watch next week

            Despite political wrangling and macro uncertainty, the technology sector has entered the fourth quarter showing positive momentum. AI hardware remains a pivotal theme, while landmark deals and investment rounds underscore bullish sentiment among both corporate insiders and institutional investors.

            Careful navigation of evolving US policy, global supply chain challenges and shifting capital flows will be critical for tech sector leadership as the final quarter of 2025 progresses.

            Next week, investors will await commentary following a planned meeting between Canadian Prime Minister Mark Carney and US President Donald Trump in Washington on October 6 to negotiate a deal to reduce US tariffs.

            Their meeting precedes a scheduled review of the US-Mexico-Canada Agreement.

            US Federal Reserve discussions and related market updates will continue shaping investor sentiment as markets await more clarity on monetary policy and inflation dynamics. The likelihood of delays in key economic data releases remains high due to the ongoing US government shutdown.

            Q3 earnings from Applied Digital (NASDAQ:APLD), set for release on October 9, will provide insights into the company’s progress on its AI-focused data center expansions. The report could be a key indicator of trends and demand in the rapidly growing AI infrastructure market, potentially influencing broader industry sentiment.

            Securities Disclosure: I, Meagen Seatter, hold no direct investment interest in any company mentioned in this article.

            This post appeared first on investingnews.com

            The big news impacting markets this week is the shutdown of the US government.

            While lawmakers were trying to find a funding solution, Democratic and Republican lawmakers were at loggerheads over maintaining funding for Medicaid programs. It marks the first time in seven years that the government has been shut down — the last time came during negotiations over the disputed US-Mexico border wall in December 2018.

            President Donald Trump has resolved to use the closure to push through the firing of thousands of federal government employees and cut funding to projects promised by Democrats.

            Additionally, the jobs report, scheduled for release on Friday (October 3), was delayed, causing greater uncertainty for analysts and investors who were trying to gauge the strength of the economy in September.

            Despite the lack of official government data, payroll processor ADP reported a loss of 32,000 jobs in September. The decline represents a significant difference from the 45,000 jobs analysts had expected to be added.

            Lawmakers aren’t scheduled to return to the negotiating tables until early next week.

            For more on what’s moving markets this week, check out our top market news round-up.

            Markets and commodities react

            Canadian equity markets were in positive territory this week by the end of trading Friday.

            The S&P/TSX Composite Index (INDEXTSI:OSPTX) continued its record breaking performance this week, gaining 2.33 percent on the week to close Friday at 30,471.68.

            The S&P/TSX Venture Composite Index (INDEXTSI:JX) performed even better, ending the week up 4.38 percent to 964.04. The CSE Composite Index (CSE:CSECOMP) was up 3.3 percent on to close out the week at 180.03.

            The gold price continued to climb this week, setting another new record, as it achieved an intraday high of US$3,893.82 per ounce on Thursday (October 2). It was still up 3.63 percent on the week at US$3,884.19 by Friday’s close.

            The silver price saw more significant gains, rising 6.31 percent to set a year-to-date high of US$48.30 per ounce during trading on Friday before settling at US$47.95 per ounce by 4:00 p.m. EDT.

            The silver price is trading at 14 year highs and has been closing in on records set in April of that year.

            Copper had sizable gains this week as the fallout from the closure of Freeport’s Grasberg mine continued to ripple through the market. The copper price was up 7.13 percent this week to US$5.11 per pound.

            The S&P Goldman Sachs Commodities Index (INDEXSP:SPGSCI) fell 2.12 percent to end Friday at 546.27.

            Top Canadian mining stocks this week

            How did mining stocks perform against this backdrop?

            Take a look at this week’s five best-performing Canadian mining stocks below.

            Stocks data for this article was retrieved at 4:00 p.m. EDT on Friday using TradingView’s stock screener. Only companies trading on the TSX, TSXV and CSE with market caps greater than C$10 million are included. Mineral companies within the non-energy minerals, energy minerals, process industry and producer manufacturing sectors were considered.

            1. Prospector Metals (TSXV:PPP)

            Weekly gain: 355.56 percent
            Market cap: C$128.18 million
            Share price: C$1.23

            Prospector Metals is a gold explorer working to advance its flagship ML project in the Yukon, Canada.

            The 10,869 hectare property, situated near Dawson City, is located within the Tintina Gold Belt, which is home to significant historic mining operations and current exploration and development projects.

            Exploration at the site has led to the discovery of more than two dozen high-grade gold surface occurrences, including the Bueno target, which has delivered samples with grades of up to 156 grams per metric ton (g/t).

            Shares of Prospector surged following the release of assay results on Wednesday (October 1). In its announcement, the company reported significant near-surface, high-grade assays, with one highlighted sample returning grades of 13.79 g/t gold over 44 meters, and another showing 21.93 g/t gold over 24.65 meters, including 288 g/t gold over 1 meter.

            2. Sokoman Minerals (TSXV:SIC)

            Weekly gain: 200 percent
            Market cap: C$45.92 million
            Share price: C$0.165

            Sokoman Minerals bills itself as a discovery-oriented company with a portfolio of gold projects and one of the largest land positions in Newfoundland and Labrador, Canada. It also owns a 40 percent stake in the Killick lithium project, a 40/40/20 joint venture with Benton Resources (TSXV:BEX) and Piedmont Lithium (ASX:PLL).

            Its primary focus is its flagship Moosehead gold project, located in Central Newfoundland. The project consists of 98 claims covering 2,450 hectares and hosts an orogenic Fosterville-style gold system, according to Sokoman. The company has defined seven zones with high-grade mineralization through over 130,000 meters of drilling.

            Sokomon reported on September 12 that it planned to start diamond drilling at the site with a focus on testing the Eastern and Western Trend zones for depth extensions, as well as undiscovered parallel zones. Additionally, the company said on September 2 that it had expanded its land position at the Crippleback Lake gold-copper property to 13,000 hectares and planned to mobilize for induced-polarization surveys, sampling and mapping of the site.

            The most recent news from the company came on Monday (September 29), when it announced that Denis Laviolette was appointed to the roles of director, executive chair and CEO. Laviolette joins the company with over two decades of experience in the mining industry, including roles in geology and production, and as an industry analyst.

            The company also announced that Timothy Froude will be transitioning to the role of company president, having previously held both the president and CEO roles. Additionally, Gary Nassif, former senior vice president of Lode Gold Resources (TSXV:LOD,OTCQB:LODFF), was appointed as a director, and Greg Matheson, former COO of New Found Gold (TSXV:NFG,NYSEAMERICAN:NFGC), was named vice president of exploration.

            3. Kesselrun Resources (TSXV:KES)

            Weekly gain: 118.18 percent
            Market cap: C$10.82 million
            Share price: C$0.12

            Kesselrun Resources is an explorer working to advance the Huronian gold project in Ontario, Canada.

            The project is located in a region with significant exploration and mining assets, including Agnico Eagle Mines’ (TSX:AEM,NYSE:AEM) Hammond Reef project and New Gold’s (NYSE:NGD,TSX:NGD) Rainy River mine. Historic indicated resources at Huronian are 45,000 ounces of gold, with inferred quantities of 501,000 ounces or gold.

            Shares of Kesselrun surged this week after Gold X2 Mining (TSXV:AUXX,OTCQB:GSHRF) announced on Wednesday that it had signed a definitive agreement to acquire Kesselrun. Gold X2 said the transaction will give it a 100 percent interest in the Huronian project, which is located adjacent to its own Moss gold project.

            4. Royal Road Minerals (TSXV:RYR)

            Weekly gain: 104.35 percent
            Market cap: C$55.80 million
            Share price: C$0.235

            Royal Road is an exploration company working to advance its Güintar and Margaritas projects and the El Aleman mining concession in Colombia. The company acquired the adjacent Güintar and Margaritas properties, located near Medellin, from major miner AngloGold Ashanti (NYSE:AU,JSE:ANG) in 2019. Since that time, Royal Road has drilled a total of 13,700 meters across 45 drill holes at Güintar, while Margaritas remains untested.

            Assays have produced a highlighted intersection of 1 g/t gold equivalent over 303.7 meters, which includes 2.1 g/t gold, 12.4 parts per million silver and 0.6 percent copper over 62 meters.

            Shares of Royal Road gained this week alongside a pair of news releases. On Monday, the company announced that Rio2 (TSXV:RIO,OTCQX:RIOFF) has acquired approximately 15 percent of Royal Road’s issued and outstanding shares as part of a block trade; they were previously held by a single investor.

            The other release came on Tuesday (September 30), when Royal Road reported that it has engaged with state and local authorities, as well as the local community, to restart work at Güintar and Margaritas.

            5. StrikePoint Gold (TSXV:SKP)

            Weekly gain: 103.85 percent
            Market cap: C$12.06 million
            Share price: C$0.265

            StrikePoint Gold is an explorer with a focus on its Hercules gold project in Nevada, US.

            The 100 square kilometer site, located within the Walker Lane Trend, hosts five drill-tested targets, with over 300 holes. The company acquired the property in August 2024 from Elevation Gold Mining for a total consideration of C$250,000, along with a 3 percent royalty on certain claims. On April 28, the company released results from its spring drilling program, with one highlighted assay returning values of 0.54 g/t gold and 4.62 g/t silver from 32.04 meters below surface; that includes an interval of 1.14 g/t gold and 10.53 g/t silver over 4.57 meters.

            The most recent news from the project was announced on September 23, when StrikePoint said it had received drill permits for the Pony Meadows target. The company noted that it is permitted to mobilize up to three rigs, and will focus on a 2.6 kilometer structure that was revealed during surface exploration.

            StrikePoint said it has two additional permits for the Sirens and Como Comet targets.

            FAQs for Canadian mining stocks

            What is the difference between the TSX and TSXV?

            The TSX, or Toronto Stock Exchange, is used by senior companies with larger market caps, and the TSXV, or TSX Venture Exchange, is used by smaller-cap companies. Companies listed on the TSXV can graduate to the senior exchange.

            How many mining companies are listed on the TSX and TSXV?

            As of May 2025, there were 1,565 companies listed on the TSXV, 910 of which were mining companies. Comparatively, the TSX was home to 1,899 companies, with 181 of those being mining companies.

            Together, the TSX and TSXV host around 40 percent of the world’s public mining companies.

            How much does it cost to list on the TSXV?

            There are a variety of different fees that companies must pay to list on the TSXV, and according to the exchange, they can vary based on the transaction’s nature and complexity. The listing fee alone will most likely cost between C$10,000 to C$70,000. Accounting and auditing fees could rack up between C$25,000 and C$100,000, while legal fees are expected to be over C$75,000 and an underwriters’ commission may hit up to 12 percent.

            The exchange lists a handful of other fees and expenses companies can expect, including but not limited to security commission and transfer agency fees, investor relations costs and director and officer liability insurance.

            These are all just for the initial listing, of course. There are ongoing expenses once companies are trading, such as sustaining fees and additional listing fees, plus the costs associated with filing regular reports.

            How do you trade on the TSXV?

            Investors can trade on the TSXV the way they would trade stocks on any exchange. This means they can use a stock broker or an individual investment account to buy and sell shares of TSXV-listed companies during the exchange’s trading hours.

            Article by Dean Belder; FAQs by Lauren Kelly.

            Securities Disclosure: I, Dean Belder, hold no direct investment interest in any company mentioned in this article.

            Securities Disclosure: I, Lauren Kelly, hold no direct investment interest in any company mentioned in this article.

            This post appeared first on investingnews.com

            The gold price continued to move this week, approaching the US$3,900 per ounce level and setting a fresh all-time high on the back of a US government shutdown.

            The closure came after Congress failed to reach an agreement on a spending bill ahead of the new American fiscal year, which began on Wednesday (October 1).

            Democrats and Republicans are at odds as Democrats push for changes to the bill, including an extension to billions of dollars in Obamacare subsidies; meanwhile, President Donald Trump has threatened thousands of permanent layoffs, not just temporary furloughs.

            This shutdown is the 15th since 1981, and according to Senate Majority Leader John Thune, it could continue on until next week as the two sides negotiate. The longest government shutdown happened between 2018 and 2019, during Trump’s first presidency, and lasted for 35 days.

            Part of the reason market watchers see this shutdown as significant is that it will delay the release of the latest nonfarm payrolls report, which was set to come out on Friday (October 3).

            Depending on how long the shutdown lasts, September consumer price index data, which is scheduled for publication on October 15, may also not be on time.

            The US Federal Reserve is due to meet later this month, from October 28 to 29, and normally would use this and other data to help make its decision on interest rates. The central bank cut rates by 25 basis points at its September meeting, and CME Group’s (NASDAQ:CME) FedWatch tool currently shows strong expectations for another 25 basis point reduction at the next gathering.

            Although gold took a breather after nearing US$3,900, it remains historically high, with many market watchers suggesting US$4,000 is in the cards in the near term.

            In the longer term, some experts have even loftier expectations — for example, Adam Rozencwajg of Goehring & Rozenwajg sees a path to a five-figure gold price.

            ‘It’s not going to happen under normal circumstances — it’s not going to happen when everything’s going great. But by the end of this cycle, will we get there? I think we probably will,’ he said.

            It’s also worth touching on silver, which pushed past the US$48 per ounce mark this week. Unlike gold, silver has not yet broken its all-time high during this bull run — it’s pushing up against uncharted territory, raising questions about how high it can go this time.

            On that note, David Morgan of the Morgan Report shared several factors that would tell him the market is reaching a top. Here’s what he said:

            ‘You want to look at exchange-traded fund flows like the GDX, GDXJ, SIL and SILJ. At the same time, more important than almost anything is trading volume at the stock level. When mid-tier and smaller producers suddenly trade three, four or five times their normal daily volume, and prices are rising, that isn’t random. That’s retail money coming back into the market, and fund buying and probably institutions.

            ‘One more layer of confirmation is relative to performance. When the mining sector starts to outperform the S&P 500 (INDEXSP:.INX), which it has, and the Nasdaq (INDEXNASDAQ:.IXIC), which it has, it’s a telltale sign that the generalist money, not just the hard money crowd, is beginning to rotate in.’

            Bullet briefing — CEO shakeup at Barrick, Newmont

            Barrick Mining (TSX:ABX,NYSE:B) and Newmont (NYSE:NEM,ASX:NEM) both announced major executive changes this week, with the CEOs of both companies departing.

            Barrick’s Mark Bristow unexpectedly stepped down from his position on Monday (September 29) after nearly seven years at the helm of the firn. His exit, which was effective immediately, comes after big changes at the firm, including a shift toward copper and an asset divestment program designed to hone the company’s focus on tier-one assets.

            It also follows persistent issues in Mali, where Barrick lost control of its gold-mining complex and had 3 metric tons of the yellow metal seized by the government.

            According to Reuters, Bristow’s handling of that ongoing situation was the final straw that prompted the company’s board to push for a change in leadership.

            Newmont announced the retirement of Tom Palmer the same day. He had held the position since 2019, and will be succeeded by the company’s president and COO. Analysts note that Newmont had been signaling that a succession plan was in the works.

            Similar to Barrick, the company has been in the midst of an extensive program geared at streamlining its portfolio. Newmont acquired Newcrest Mining in 2023, and in February 2024 announced a program to sell non-core assets. It completed the program in April of this year, but has continued to make portfolio adjustments, and to pursue other cost-saving measures.

            Market watchers note that despite efforts to boost efficiency, Barrick and Newmont have both failed to match the performance of their peers during today’s bull market.

            Year-on-year share price performance of major gold miners.

            Chart via Google Finance.

            With gold-mining companies conscious of not repeating missteps made during the precious metal’s last runup, investors will no doubt be keen to see how they perform under new management.

            Securities Disclosure: I, Charlotte McLeod, hold no direct investment interest in any company mentioned in this article.

            This post appeared first on investingnews.com

            Markets don’t usually hit record highs, risk falling into bearish territory, and spring back to new highs within six months. But that’s what happened in 2025.

            In this special mid-year recap, Grayson Roze sits down with David Keller, CMT, to show how disciplined routines, price-based signals, and a calm process helped them ride the whipsaw instead of getting tossed by it. You’ll see what really happened under the surface, how investor psychology drove the swings, and the exact StockCharts tools they leaned on to stay objective. 

            If you’re focused on protecting capital, generating income, and sleeping well at night while still capturing the upside, this is a must-watch. Discover which charts deserve your attention now, what to ignore, and how to prep for the back half of 2025. 

            This video premiered on July 23, 2025. Click on the above image to watch on our dedicated Grayson Roze page on StockCharts TV.

            You can view previously recorded videos from Grayson at this link.

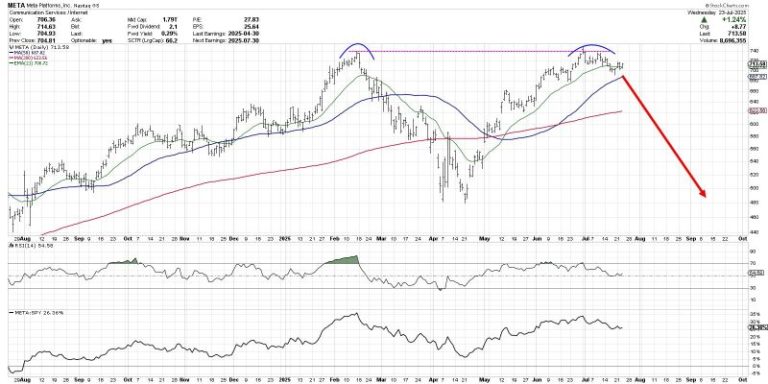
            The chart of Meta Platforms, Inc. (META) has completed a roundtrip from the February high around $740 to the April low at $480 and all the way back again.  Over the last couple weeks, META has now pulled back from its retest of all-time highs, leaving investors to wonder what may come next.

            Is this the beginning of a new downtrend phase for META?  Or just a brief pullback before a new uptrend phase propels META to new all-time highs?

            Today we’ll look at two potential scenarios, including the double top pattern and the cup and handle pattern, and share which technical indicators and approaches could help us determine which path plays out into August.

            The double top scenario basically means that the late July retest of the previous all-time high was the end of the recent uptrend phase.  The double top pattern is literally when a major resistance level is set and then retested.  The implication is that a lack of willing buyers means the uptrend is exhausted, and there is nowhere to go but down.

            While the 21-day exponential moving average is currently in play for META, I would say that a break below the 50-day moving average could confirm this as the correct scenario.  If that smoothing mechanism does not hold, then the price action would imply less of a pullback and more like the beginning of a real distribution phase.

            What is META pulls back but then resumes an uptrend phase, leading META to another new all-time high?  That would result in a confirmed cup and handle pattern, created by a large rounded bottoming pattern followed by a brief pullback.  The key to this pattern is the “rim” of the cup, which sits right at $740 for META.

            Given the pullback META has demonstrated so far in July, I would say that a break above the $740 level would basically confirm a bullish cup and handle pattern.  That would suggest much more upside potential for META, as the stock would literally go into previously uncharted territory.

            So how can we determine which scenario is more likely to play out?  This is where we need to incorporate more technical indicators into the discussion, as a way to further validate and confirm our investment thesis.

            Just to review, I think a break above $740 would confirm a bullish cup and handle pattern.  I would also say that a break below the $680 level, which would represent a move below the 50-day moving average as well as the June swing lows, would basically confirm a bearish double top pattern.

            We can also use the Relative Strength Index (RSI) to help determine whether META remains in a bullish trend phase.  During bull phases, the RSI rarely gets below 40, because buyers usually step in to “buy the dips” and keep the momentum fairly constructive.  So if the price would break down, and the RSI would not hold that crucial 40 level, that could mean a bearish outlook is warranted.

            Finally, we can use volume-based indicators to assess whether moves in the price are supported by stronger volume readings.  Here I’ve included the Accumulation/Distribution Line, which tracks the trend in daily volume readings over time.  We can see that the high in July resulted in a divergence, as the A/D line was trending lower.  If the A/D line would break below its June and July lows, marked by a dashed red line, that would represent a bearish volume reading for META.

            Technical analysis is less about predicting the future, and more about determining the most probable scenarios based on our analysis of trend, momentum, and volume.  I hope this discussion shows how the outlook for META can be easily determined and tracked using the best practices of technical analysis!

            RR#6,

            Dave

            PS- Ready to upgrade your investment process?  Check out my free behavioral investing course!

            David Keller, CMT

            President and Chief Strategist

            Sierra Alpha Research LLC

            marketmisbehavior.com

            https://www.youtube.com/c/MarketMisbehavior

            Disclaimer: This blog is for educational purposes only and should not be construed as financial advice.  The ideas and strategies should never be used without first assessing your own personal and financial situation, or without consulting a financial professional.  

            The author does not have a position in mentioned securities at the time of publication.    Any opinions expressed herein are solely those of the author and do not in any way represent the views or opinions of any other person or entity.

            Is the market’s next surge already underway? Find out with Tom Bowley’s breakdown of where the money is flowing now and how you can get in front of it.

            In this video, Tom covers key moves in the major indexes, revealing strength in transports, small caps, and home construction. He identifies industry rotation signals, which are pointing to aluminum, recreational products, and furnishings. Tom then demonstrates how to use StockCharts’ tools to scan for momentum stocks in emerging leadership groups — see why SGI tops Tom’s list. He ends with a discussion of post-earnings reactions from major names like GOOGL, TSLA, IBM, and LVS. 

            And, of course, Tom wraps every idea with clear chart setups you can act on today. 

            This video premiered on July 24, 2025. Click this link to watch on Tom’s dedicated page.

            Missed a session? Archived videos from Tom are available at this link.

            The S&P 500 ($SPX) just logged its fifth straight trading box breakout, which means that, of the five trading ranges the index has experienced since the April lows, all have been resolved to the upside.

            How much longer can this last? That’s been the biggest question since the massive April 9 rally. Instead of assuming the market is due to roll over, it’s been more productive to track price action and watch for potential changes along the way. So far, drawdowns have been minimal, and breakouts keep occurring. Nothing in the price action hints at a lasting change — yet.

            While some are calling this rally “historic,” we have a recent precedent. Recall that from late 2023 through early 2024, the index had a strong start and gave way to a consistent, steady trend.

            From late October 2023 through March 2024, the S&P 500 logged seven consecutive trading box breakouts. That streak finally paused with a pullback from late March to early April, which, as we now know, was only a temporary hiccup. Once the bid returned, the S&P 500 went right back to carving new boxes and climbing higher.

            New 52-Week Highs Finally Picking Up

            If there’s been one gripe about this rally, it’s that the number of new highs within the index has lagged. As we’ve discussed before, among all the internal breadth indicators available, new highs almost always lag — that’s normal. What we really want to see is whether the number of new highs begins to exceed prior peaks as the market continues to rise, which it has, as shown by the blue line in the chart below.

            As of Wednesday’s close, 100 S&P 500 stocks were either at new 52-week highs or within 3% of them. That’s a strong base. We expect this number to continue rising as the market climbs, especially if positive earnings reactions persist across sectors.

            Even when we get that first day with 100+ S&P 500 stocks making new 52-week highs, though, it might not be the best time to initiate new longs.

            The above chart shows that much needs to align for that many stocks to peak in unison, which has historically led to at least a short-term consolidation, if not deeper pullbacks — as highlighted in yellow. Every time is different, of course, but this is something to keep an eye on in the coming weeks.

            Trend Check: GoNoGo Still “Go”

            The GoNoGo Trend remains in bullish mode, with the recent countertrend signals having yet to trigger a greater pullback.

            Active Bullish Patterns

            We still have two live bullish upside targets of 6,555 and 6,745, which could be with us for a while going forward. For the S&P 500 to get there, it will need to form new, smaller versions of the trading boxes.

            Failed Bearish Patterns

            In the chart below, you can view a rising wedge pattern on the recent price action, the third since April. The prior two wedges broke down briefly and did not lead to a major downturn. The largest pullbacks in each case occurred after the S&P 500 dipped below the lower trendline of the pattern.

            The deepest drawdown so far is 3.5%, which is not exactly a game-changer. Without downside follow-through, a classic bearish pattern simply can’t be formed, let alone be broken down from.

            We’ll continue to monitor these formations as they develop because, at some point, that will change.

            Here are some charts that reflect our areas of focus this week at


            XLU Leads with New High

            Even though the Utilities SPDR (XLU) cannot keep pace with the Technology SPDR (XLK) and Communication Services SPDR (XLC), it is in a leading uptrend. XLU formed a cup-with-handle from November to July and broke to new highs the last two weeks. ETFs hitting new highs are in strong uptrends and should be on our radar.


            Metal Mania in 2025

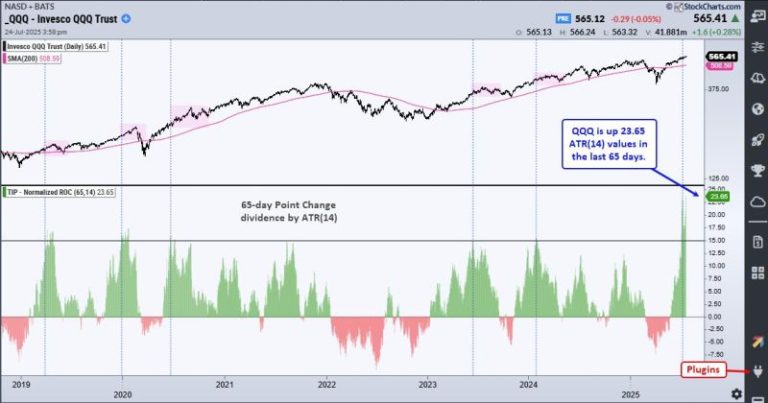
            In a tribute to Ozzy, metals are leading the way higher in 2025. The PerfChart below shows year-to-date performance for the continuous futures for 12 commodities. Copper, Platinum and Palladium are up more than 45% year-to-date, while Gold is up 28.38% and Silver is up 35.30%. QQQ is up 10.52% year-to-date, but lagging these metals. The other commodities are mixed.


            Multi-Year Highs for Silver and Copper

            The next chart shows 11 year bar charts for five metals. Gold broke out in early 2024 and led the metals move with an advance the last 21 months. Silver and copper broke out to multi-year highs. Platinum broke above its 2021 high and Palladium got in the action with an 18 month high. There is a clear message here: metals are moving higher and leading as a group.  


            Home Construction Hits Moment of Truth

            The Home Construction ETF (ITB) hit its moment of truth as it rose to its falling 40-week SMA. Notice that ITB failed just below this moving average in August 2023. During the 2023-2024 uptrend, the 40-week SMA was more friendly as ITB reversed near this level in October 2023 and June 2024. ITB surged to the falling 40-week SMA in July, but the long-term trend is down and this area could be its nemesis.

            Thanks for Tuning in!

            See TrendInvestorPro.com for more


            Valeura Energy Inc. (TSX:VLE, OTCQX:VLERF) (‘Valeura’ or the ‘Company’) has been ranked No. 1 on the Report on Business magazine’s 2025 ranking of Canada’s Top Growing Companies, as published on September 26, 2025.

            Valeura achieved the top position among 400 candidate companies across all sectors, based on three-year revenue growth. The Company’s revenue increased from US$3 million in 2021 to US$689 million in 2024, representing a 20,064% increase. This recognition follows the Company’s No. 8 ranking in 2024, reflecting sustained momentum in value creation and operational execution.

            Dr. Sean Guest, President and CEO commented:

            ‘We are honoured to receive this exceptional recognition from the Report on Business magazine. Achieving the No. 1 position among 400 companies across all industries validates our disciplined approach to creating value through growth.

            Since launching our growth strategy in 2020, our team has demonstrated top tier operational and financial performance. At the same time, we have remained highly discerning in selecting which opportunities to pursue. Our revenue growth of 20,064% over three years underscores the fact that our strategy is working.

            As we continue to actively pursue organic and inorganic opportunities to create value for all stakeholders, I extend my sincere gratitude to the many individuals who have supported our journey.’

            About the Ranking

            The Report on Business magazine is published by The Globe And Mail, widely regarded as Canada’s foremost news media company. Their annual editorial ranking of Canada’s Top Growing Companies measures businesses on three-year revenue growth. The complete 2025 ranking is listed here.

            About the Company

            Valeura is a Canadian public company engaged in the exploration, development and production of petroleum and natural gas in Thailand and in Türkiye. The Company is pursuing a growth-oriented strategy and intends to re-invest into its producing asset portfolio and to deploy resources toward further organic and inorganic growth in Southeast Asia. Valeura aspires toward value accretive growth for stakeholders while adhering to high standards of environmental, social and governance responsibility.

            Additional information relating to Valeura is also available on SEDAR+ at www.sedarplus.ca.

            For further information, please contact:

            Valeura Energy Inc. (General Corporate Enquiries)
            +65 6373 6940
            Sean Guest, President and CEO
            Yacine Ben-Meriem, CFO
            Contact@valeuraenergy.com

            Valeura Energy Inc. (Investor and Media Enquiries)
            +1 403 975 6752 / +44 7392 940495
            Robin James Martin, Vice President, Communications and Investor Relations
            IR@valeuraenergy.com

            This news release does not constitute an offer to sell or the solicitation of an offer to buy securities in any jurisdiction, including where such offer would be unlawful. This news release is not for distribution or release, directly or indirectly, in or into the United States, Ireland, the Republic of South Africa or Japan or any other jurisdiction in which its publication or distribution would be unlawful.

            Neither the Toronto Stock Exchange nor its Regulation Services Provider (as that term is defined in the policies of the Toronto Stock Exchange) accepts responsibility for the adequacy or accuracy of this news release.

            Source

            This post appeared first on investingnews.com

            Adam Rozencwajg, managing partner at Goehring & Rozencwajg, discusses the factors driving gold’s current price run and why he thinks it will continue.

            ‘I think that this rally is sustained. I think that it’s going on until I see otherwise,’ he said.

            Securities Disclosure: I, Charlotte McLeod, hold no direct investment interest in any company mentioned in this article.

            This post appeared first on investingnews.com