Archive

October 3, 2025

Browsing

Markets don’t usually hit record highs, risk falling into bearish territory, and spring back to new highs within six months. But that’s what happened in 2025.

In this special mid-year recap, Grayson Roze sits down with David Keller, CMT, to show how disciplined routines, price-based signals, and a calm process helped them ride the whipsaw instead of getting tossed by it. You’ll see what really happened under the surface, how investor psychology drove the swings, and the exact StockCharts tools they leaned on to stay objective. 

If you’re focused on protecting capital, generating income, and sleeping well at night while still capturing the upside, this is a must-watch. Discover which charts deserve your attention now, what to ignore, and how to prep for the back half of 2025. 

This video premiered on July 23, 2025. Click on the above image to watch on our dedicated Grayson Roze page on StockCharts TV.

You can view previously recorded videos from Grayson at this link.

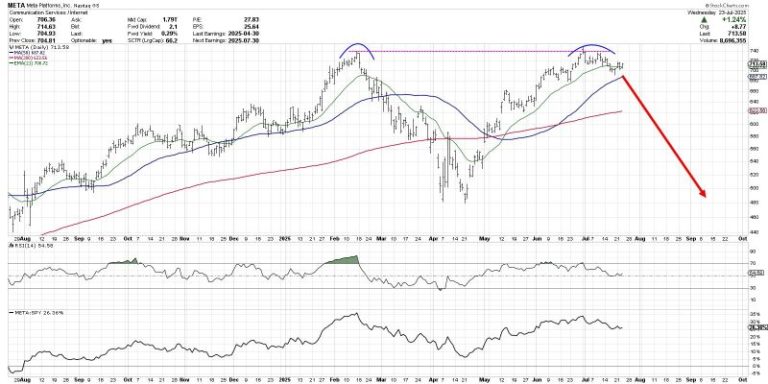
The chart of Meta Platforms, Inc. (META) has completed a roundtrip from the February high around $740 to the April low at $480 and all the way back again.  Over the last couple weeks, META has now pulled back from its retest of all-time highs, leaving investors to wonder what may come next.

Is this the beginning of a new downtrend phase for META?  Or just a brief pullback before a new uptrend phase propels META to new all-time highs?

Today we’ll look at two potential scenarios, including the double top pattern and the cup and handle pattern, and share which technical indicators and approaches could help us determine which path plays out into August.

The double top scenario basically means that the late July retest of the previous all-time high was the end of the recent uptrend phase.  The double top pattern is literally when a major resistance level is set and then retested.  The implication is that a lack of willing buyers means the uptrend is exhausted, and there is nowhere to go but down.

While the 21-day exponential moving average is currently in play for META, I would say that a break below the 50-day moving average could confirm this as the correct scenario.  If that smoothing mechanism does not hold, then the price action would imply less of a pullback and more like the beginning of a real distribution phase.

What is META pulls back but then resumes an uptrend phase, leading META to another new all-time high?  That would result in a confirmed cup and handle pattern, created by a large rounded bottoming pattern followed by a brief pullback.  The key to this pattern is the “rim” of the cup, which sits right at $740 for META.

Given the pullback META has demonstrated so far in July, I would say that a break above the $740 level would basically confirm a bullish cup and handle pattern.  That would suggest much more upside potential for META, as the stock would literally go into previously uncharted territory.

So how can we determine which scenario is more likely to play out?  This is where we need to incorporate more technical indicators into the discussion, as a way to further validate and confirm our investment thesis.

Just to review, I think a break above $740 would confirm a bullish cup and handle pattern.  I would also say that a break below the $680 level, which would represent a move below the 50-day moving average as well as the June swing lows, would basically confirm a bearish double top pattern.

We can also use the Relative Strength Index (RSI) to help determine whether META remains in a bullish trend phase.  During bull phases, the RSI rarely gets below 40, because buyers usually step in to “buy the dips” and keep the momentum fairly constructive.  So if the price would break down, and the RSI would not hold that crucial 40 level, that could mean a bearish outlook is warranted.

Finally, we can use volume-based indicators to assess whether moves in the price are supported by stronger volume readings.  Here I’ve included the Accumulation/Distribution Line, which tracks the trend in daily volume readings over time.  We can see that the high in July resulted in a divergence, as the A/D line was trending lower.  If the A/D line would break below its June and July lows, marked by a dashed red line, that would represent a bearish volume reading for META.

Technical analysis is less about predicting the future, and more about determining the most probable scenarios based on our analysis of trend, momentum, and volume.  I hope this discussion shows how the outlook for META can be easily determined and tracked using the best practices of technical analysis!

RR#6,

Dave

PS- Ready to upgrade your investment process?  Check out my free behavioral investing course!

David Keller, CMT

President and Chief Strategist

Sierra Alpha Research LLC

marketmisbehavior.com

https://www.youtube.com/c/MarketMisbehavior

Disclaimer: This blog is for educational purposes only and should not be construed as financial advice.  The ideas and strategies should never be used without first assessing your own personal and financial situation, or without consulting a financial professional.  

The author does not have a position in mentioned securities at the time of publication.    Any opinions expressed herein are solely those of the author and do not in any way represent the views or opinions of any other person or entity.

Is the market’s next surge already underway? Find out with Tom Bowley’s breakdown of where the money is flowing now and how you can get in front of it.

In this video, Tom covers key moves in the major indexes, revealing strength in transports, small caps, and home construction. He identifies industry rotation signals, which are pointing to aluminum, recreational products, and furnishings. Tom then demonstrates how to use StockCharts’ tools to scan for momentum stocks in emerging leadership groups — see why SGI tops Tom’s list. He ends with a discussion of post-earnings reactions from major names like GOOGL, TSLA, IBM, and LVS. 

And, of course, Tom wraps every idea with clear chart setups you can act on today. 

This video premiered on July 24, 2025. Click this link to watch on Tom’s dedicated page.

Missed a session? Archived videos from Tom are available at this link.

The S&P 500 ($SPX) just logged its fifth straight trading box breakout, which means that, of the five trading ranges the index has experienced since the April lows, all have been resolved to the upside.

How much longer can this last? That’s been the biggest question since the massive April 9 rally. Instead of assuming the market is due to roll over, it’s been more productive to track price action and watch for potential changes along the way. So far, drawdowns have been minimal, and breakouts keep occurring. Nothing in the price action hints at a lasting change — yet.

While some are calling this rally “historic,” we have a recent precedent. Recall that from late 2023 through early 2024, the index had a strong start and gave way to a consistent, steady trend.

From late October 2023 through March 2024, the S&P 500 logged seven consecutive trading box breakouts. That streak finally paused with a pullback from late March to early April, which, as we now know, was only a temporary hiccup. Once the bid returned, the S&P 500 went right back to carving new boxes and climbing higher.

New 52-Week Highs Finally Picking Up

If there’s been one gripe about this rally, it’s that the number of new highs within the index has lagged. As we’ve discussed before, among all the internal breadth indicators available, new highs almost always lag — that’s normal. What we really want to see is whether the number of new highs begins to exceed prior peaks as the market continues to rise, which it has, as shown by the blue line in the chart below.

As of Wednesday’s close, 100 S&P 500 stocks were either at new 52-week highs or within 3% of them. That’s a strong base. We expect this number to continue rising as the market climbs, especially if positive earnings reactions persist across sectors.

Even when we get that first day with 100+ S&P 500 stocks making new 52-week highs, though, it might not be the best time to initiate new longs.

The above chart shows that much needs to align for that many stocks to peak in unison, which has historically led to at least a short-term consolidation, if not deeper pullbacks — as highlighted in yellow. Every time is different, of course, but this is something to keep an eye on in the coming weeks.

Trend Check: GoNoGo Still “Go”

The GoNoGo Trend remains in bullish mode, with the recent countertrend signals having yet to trigger a greater pullback.

Active Bullish Patterns

We still have two live bullish upside targets of 6,555 and 6,745, which could be with us for a while going forward. For the S&P 500 to get there, it will need to form new, smaller versions of the trading boxes.

Failed Bearish Patterns

In the chart below, you can view a rising wedge pattern on the recent price action, the third since April. The prior two wedges broke down briefly and did not lead to a major downturn. The largest pullbacks in each case occurred after the S&P 500 dipped below the lower trendline of the pattern.

The deepest drawdown so far is 3.5%, which is not exactly a game-changer. Without downside follow-through, a classic bearish pattern simply can’t be formed, let alone be broken down from.

We’ll continue to monitor these formations as they develop because, at some point, that will change.

Here are some charts that reflect our areas of focus this week at


XLU Leads with New High

Even though the Utilities SPDR (XLU) cannot keep pace with the Technology SPDR (XLK) and Communication Services SPDR (XLC), it is in a leading uptrend. XLU formed a cup-with-handle from November to July and broke to new highs the last two weeks. ETFs hitting new highs are in strong uptrends and should be on our radar.


Metal Mania in 2025

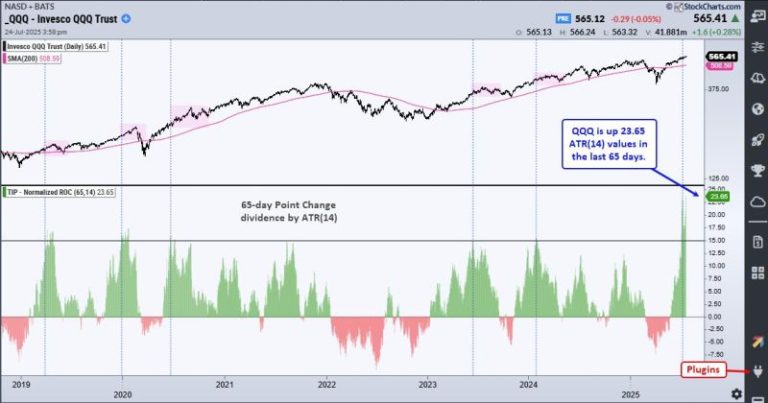
In a tribute to Ozzy, metals are leading the way higher in 2025. The PerfChart below shows year-to-date performance for the continuous futures for 12 commodities. Copper, Platinum and Palladium are up more than 45% year-to-date, while Gold is up 28.38% and Silver is up 35.30%. QQQ is up 10.52% year-to-date, but lagging these metals. The other commodities are mixed.


Multi-Year Highs for Silver and Copper

The next chart shows 11 year bar charts for five metals. Gold broke out in early 2024 and led the metals move with an advance the last 21 months. Silver and copper broke out to multi-year highs. Platinum broke above its 2021 high and Palladium got in the action with an 18 month high. There is a clear message here: metals are moving higher and leading as a group.  


Home Construction Hits Moment of Truth

The Home Construction ETF (ITB) hit its moment of truth as it rose to its falling 40-week SMA. Notice that ITB failed just below this moving average in August 2023. During the 2023-2024 uptrend, the 40-week SMA was more friendly as ITB reversed near this level in October 2023 and June 2024. ITB surged to the falling 40-week SMA in July, but the long-term trend is down and this area could be its nemesis.

Thanks for Tuning in!

See TrendInvestorPro.com for more


Valeura Energy Inc. (TSX:VLE, OTCQX:VLERF) (‘Valeura’ or the ‘Company’) has been ranked No. 1 on the Report on Business magazine’s 2025 ranking of Canada’s Top Growing Companies, as published on September 26, 2025.

Valeura achieved the top position among 400 candidate companies across all sectors, based on three-year revenue growth. The Company’s revenue increased from US$3 million in 2021 to US$689 million in 2024, representing a 20,064% increase. This recognition follows the Company’s No. 8 ranking in 2024, reflecting sustained momentum in value creation and operational execution.

Dr. Sean Guest, President and CEO commented:

‘We are honoured to receive this exceptional recognition from the Report on Business magazine. Achieving the No. 1 position among 400 companies across all industries validates our disciplined approach to creating value through growth.

Since launching our growth strategy in 2020, our team has demonstrated top tier operational and financial performance. At the same time, we have remained highly discerning in selecting which opportunities to pursue. Our revenue growth of 20,064% over three years underscores the fact that our strategy is working.

As we continue to actively pursue organic and inorganic opportunities to create value for all stakeholders, I extend my sincere gratitude to the many individuals who have supported our journey.’

About the Ranking

The Report on Business magazine is published by The Globe And Mail, widely regarded as Canada’s foremost news media company. Their annual editorial ranking of Canada’s Top Growing Companies measures businesses on three-year revenue growth. The complete 2025 ranking is listed here.

About the Company

Valeura is a Canadian public company engaged in the exploration, development and production of petroleum and natural gas in Thailand and in Türkiye. The Company is pursuing a growth-oriented strategy and intends to re-invest into its producing asset portfolio and to deploy resources toward further organic and inorganic growth in Southeast Asia. Valeura aspires toward value accretive growth for stakeholders while adhering to high standards of environmental, social and governance responsibility.

Additional information relating to Valeura is also available on SEDAR+ at www.sedarplus.ca.

For further information, please contact:

Valeura Energy Inc. (General Corporate Enquiries)
+65 6373 6940
Sean Guest, President and CEO
Yacine Ben-Meriem, CFO
Contact@valeuraenergy.com

Valeura Energy Inc. (Investor and Media Enquiries)
+1 403 975 6752 / +44 7392 940495
Robin James Martin, Vice President, Communications and Investor Relations
IR@valeuraenergy.com

This news release does not constitute an offer to sell or the solicitation of an offer to buy securities in any jurisdiction, including where such offer would be unlawful. This news release is not for distribution or release, directly or indirectly, in or into the United States, Ireland, the Republic of South Africa or Japan or any other jurisdiction in which its publication or distribution would be unlawful.

Neither the Toronto Stock Exchange nor its Regulation Services Provider (as that term is defined in the policies of the Toronto Stock Exchange) accepts responsibility for the adequacy or accuracy of this news release.

Source

This post appeared first on investingnews.com

Adam Rozencwajg, managing partner at Goehring & Rozencwajg, discusses the factors driving gold’s current price run and why he thinks it will continue.

‘I think that this rally is sustained. I think that it’s going on until I see otherwise,’ he said.

Securities Disclosure: I, Charlotte McLeod, hold no direct investment interest in any company mentioned in this article.

This post appeared first on investingnews.com

Perth, Australia (ABN Newswire) – Locksley Resources Ltd (ASX:LKY,OTC:LKYRF) (FRA:X5L) (OTCMKTS:LKYRF) is pleased to provide a market update on activities across the Mojave Critical Minerals Project in California, where the Company is rapidly advancing numerous parallel workstreams.

Highlights

– Plan of Operations approval for upsized drilling program at Desert Antimony Mine (DAM), subject to receipt of bond

– Locksley has secured a drill contractor for El Campo rare earths drilling in Q4 and is in the process of finalising the expanded drill programactivities and timeline at DAM

– Lidar surface and underground survey completed at DAM, providing detailed 3D mapping of adits and stopes to guide drill targeting and mine design

– Underground sampling program planned at DAM to validate historical grades and support resource definition

– Regional exploration advancing across newly acquired claims, extending coverage to over 40 sq km of the Mojave corridor

– Multiple parallel workstreams reinforce Locksley’s fast-track mine-tomarket strategy for U.S. antimony supply

Locksley has received approval from the Bureau of Land Management (BLM) expanding the Plan of Operations for the Desert Antimony Mine, which will become effective upon completion of the bond payment and receipt of a letter from the BLM that the bond has been accepted, this process is underway.

Following the announcement on 15th September, which outlined a significant enlargement of the exploration program at the Desert Antimony Mine (‘DAM’), Locksley has moved quickly to initiate onground activities across the broader Mojave Project.

Exploration Workstreams

– Drilling: Locksley has secured a drilling contractor for the upcoming exploration program planned for Q4 2025. The drilling at the El Campo rare earths project is designed to target the steeply dipping, structurally controlled mineralised horizon in five locations along the interpreted 860m long NW-SE striking El Campo ‘lode’. This lode hosts elevated REE, as delineated from high-grade rock chip sampling conducted during 2023. The first planned drillhole is designed to target the down-plunge El Campo outcrop dipping to the SW.

– LiDAR Surveying – DAM: A comprehensive LiDAR survey of underground adits and stopes has been completed, providing data to inform both program drilling design and future mine planning.

The underground LiDAR survey will expand Locksley’s knowledge of historic antimony production. It will also provide a 3D wireframe model of the historic underground mine, which will assist with future drill targeting aiming to delineate un-mined high-grade antimony mineralisation along strike from the historic stopes. The LiDAR survey team deployed an Elios 3 with the Rev7 LiDAR payload to map the internal spaces of the underground mine, while the team also operate the DJI M350 RTK drone equipped with the L2 LiDAR payload to capture imagery for surface mapping.

The dataset will enable the contractors to accurately integrate and geospatially align all underground scans, ensuring a comprehensive and precise 3D model of the Desert Antimony mine site.

– Underground Sampling – DAM: Systematic sampling of underground workings at DAM will commence in the near term, designed to further evaluate grade continuity and confirm historical production records.

An adit located ~50m to the south-east of the historic Desert Antimony smelter will be used to conduct UG mapping and sampling which will progress Locksley’s understanding of subsurface stibnite bearing quartz-carbonate vein orientation, grade and continuity. Two stopes crosscutting the main orientation of the adit still contain timber beams and ladders that were used for mining during the late 1920’s and 1930’s.

Evidence of sheeted massive to semi-massive stibnite bearing quartz-carbonate veining is observed to be dipping sub-vertically to the west and north-west and run parallel to the orientation of the stopes.

– Broader Exploration Activities:

o Field sampling: Regional reconnaissance and claim wide sampling will commence later this month, extending coverage across the newly acquired tenure and prospective corridors.

o Geophysics: Locksley is currenting reviewing the optimal geophysical methods to evaluate its expanded land position. Technics including airborne magnetic, radiometric surveys, Induced polarization, gravity survey and passive seismic are being evaluated. Airborne geophysics has the potential to provide additional REE anomalies that may be associated with REE-bearing carbonatite intrusions, similar to the Mountain Pass REE deposit.

o Stream sediment and rock chip sampling: Wide-spread regional stream sediment and rock chip sampling are planned across the entire North-western Block, South Block, and areas of the newly expanded North Block using coarse fraction stream sediment sampling methodology. Ongoing mapping coinciding with outcrop rock sampling will also assist in providing potential REE, antimony and base metal geochemical anomalies within the Mojave Project’s land tenure.

Kerrie Matthews, Chief Executive Officer of Locksley Resources, commented:

‘Since commencing as CEO, my focus has been on advancing Mojave through multiple, parallel workstreams. The exploration team is rapidly progressing technical programs, from securing a drill rig to underground sampling and Lidar surveys at the Desert Antimony Mine. With the Plan of Operations now approved pending bond finalisation, we are commencing activities to prepare for the initial drilling at the El Campo REE target. The team and I are extremely focused on our fast-track mine-to-market strategy and it positions Locksley to deliver near-term U.S. antimony supply into critical defense and energy supply chains.’

About Locksley Resources Limited:

Locksley Resources Limited (ASX:LKY,OTC:LKYRF) (FRA:X5L) (OTCMKTS:LKYRF) is an ASX listed explorer focused on critical minerals in the United States of America. The Company is actively advancing exploration across two key assets: the Mojave Project in California, targeting rare earth elements (REEs) and antimony. Locksley Resources aims to generate shareholder value through strategic exploration, discovery and development in this highly prospective mineral region.

Mojave Project

Located in the Mojave Desert, California, the Mojave Project comprises over 250 claims across two contiguous prospect areas, namely, the North Block/Northeast Block and the El Campo Prospect. The North Block directly abuts claims held by MP Materials, while El Campo lies along strike of the Mountain Pass Mine and is enveloped by MP Materials’ claims, highlighting the strong geological continuity and exploration potential of the project area.

In addition to rare earths, the Mojave Project hosts the historic ‘Desert Antimony Mine’, which last operated in 1937. Despite the United States currently having no domestic antimony production, demand for the metal remains high due to its essential role in defense systems, semiconductors, and metal alloys. With significant surface sample results, the Desert Mine prospect represents one of the highest-grade known antimony occurrences in the U.S.

Locksley’s North American position is further strengthened by rising geopolitical urgency to diversify supply chains away from China, the global leader in both REE & antimony production. With its maiden drilling program planned, the Mojave Project is uniquely positioned to align with U.S. strategic objectives around critical mineral independence and economic security.

Tottenham Project

Locksley’s Australian portfolio comprises the advanced Tottenham Copper-Gold Project in New South Wales, focused on VMS-style mineralisation

Source:
Locksley Resources Limited

Contact:
Locksley Resources Limited
T: +61 8 9481 0389
E: info@locksleyresources.com.au

News Provided by ABN Newswire via QuoteMedia

This post appeared first on investingnews.com