**Chart 1: USD/JPY vs. Treasury Yields**
The first chart to observe is the comparison between USD/JPY exchange rates and U.S. Treasury yields. Historically, there has been a close correlation between the two, as rising U.S. Treasury yields tend to boost the value of the U.S. dollar against the Japanese yen. This relationship is based on the concept of interest rate differentials, where higher interest rates in the U.S. attract foreign investment, leading to an appreciation in the value of the dollar.
By examining this chart, investors can gain valuable insights into potential shifts in currency movements. A divergence between USD/JPY and Treasury yields could indicate underlying market sentiment and future trends. For instance, if Treasury yields are rising while USD/JPY remains stagnant or depreciates, it may signal weakening confidence in the U.S. economy, leading to a potential reversal in the exchange rate.
**Chart 2: S&P 500 Index**
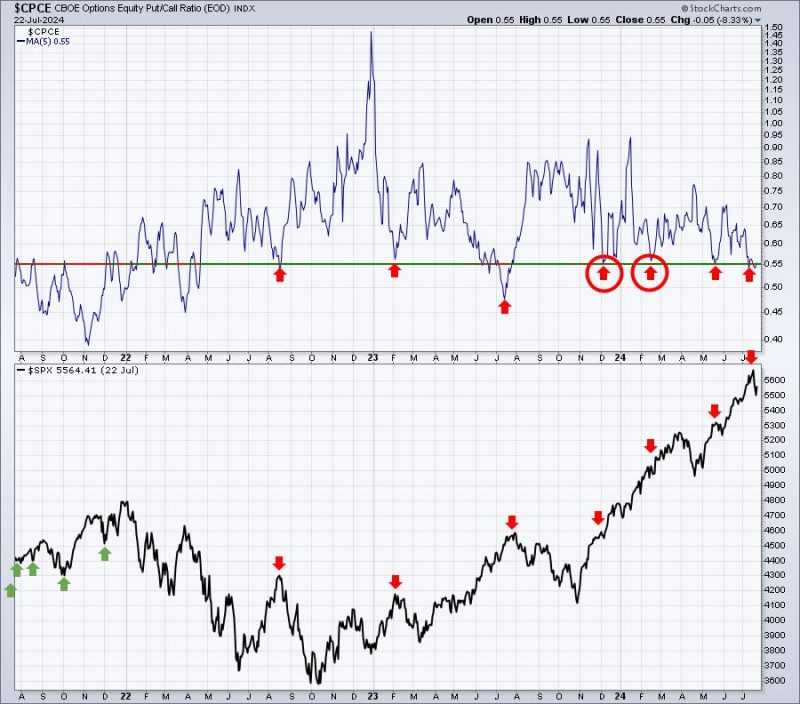
The second chart to monitor is the performance of the S&P 500 index, which serves as a critical benchmark for U.S. equities and overall market sentiment. The S&P 500 is composed of 500 of the largest publicly traded companies in the U.S., representing a diverse range of sectors and industries. As a result, changes in the index can reflect broader market trends and investor confidence.
Observing the behavior of the S&P 500 can provide valuable insights for traders and investors seeking to gauge the overall health of the stock market. A strong positive correlation between the S&P 500 and other asset classes, such as currencies or commodities, could indicate a robust market environment. Conversely, significant divergences between the index and other financial instruments may signal potential shifts in investor sentiment and market conditions.
**Chart 3: Gold vs. Real Rates**
The third chart worth monitoring is the relationship between the price of gold and real interest rates. Gold is often viewed as a safe-haven asset, particularly during times of economic uncertainty or inflationary pressure. Real interest rates, which are adjusted for inflation, play a crucial role in shaping the opportunity cost of holding gold versus other interest-bearing assets.
Analyzing the correlation between gold prices and real interest rates can provide valuable insights into the prevailing market dynamics. For instance, a scenario where gold prices are rising while real interest rates are declining could signal concerns about inflation or economic instability, driving investors towards gold as a store of value.
In conclusion, closely monitoring these three key charts – USD/JPY vs. Treasury Yields, S&P 500 Index, and Gold vs. Real Rates – can offer investors valuable insights into market trends, sentiment shifts, and potential opportunities. By incorporating these charts into their analytical toolkit, traders and investors can make more informed decisions and navigate the dynamic financial landscape with greater precision and confidence.


